consistently delivering enchanced stakeholder experience.
consistently delivering enchanced stakeholder experience.
Investment Partner
TTA Group is not only one of the few companies in Thailand with a history of over a hundred years…but also one of the leading strategic investment company with stable growth and presence throughout Asia, the Middle East and Europe.
We enthusiastically leverage our insights and expertise to find the right opportunities and timings to invest.
Our goal is to foster sustainable growth and long term value through right capital mix.
We operate a diversified business under five core business groups - Shipping, Offshore Service, Agrochemical, Food and Beverage, and Investment.
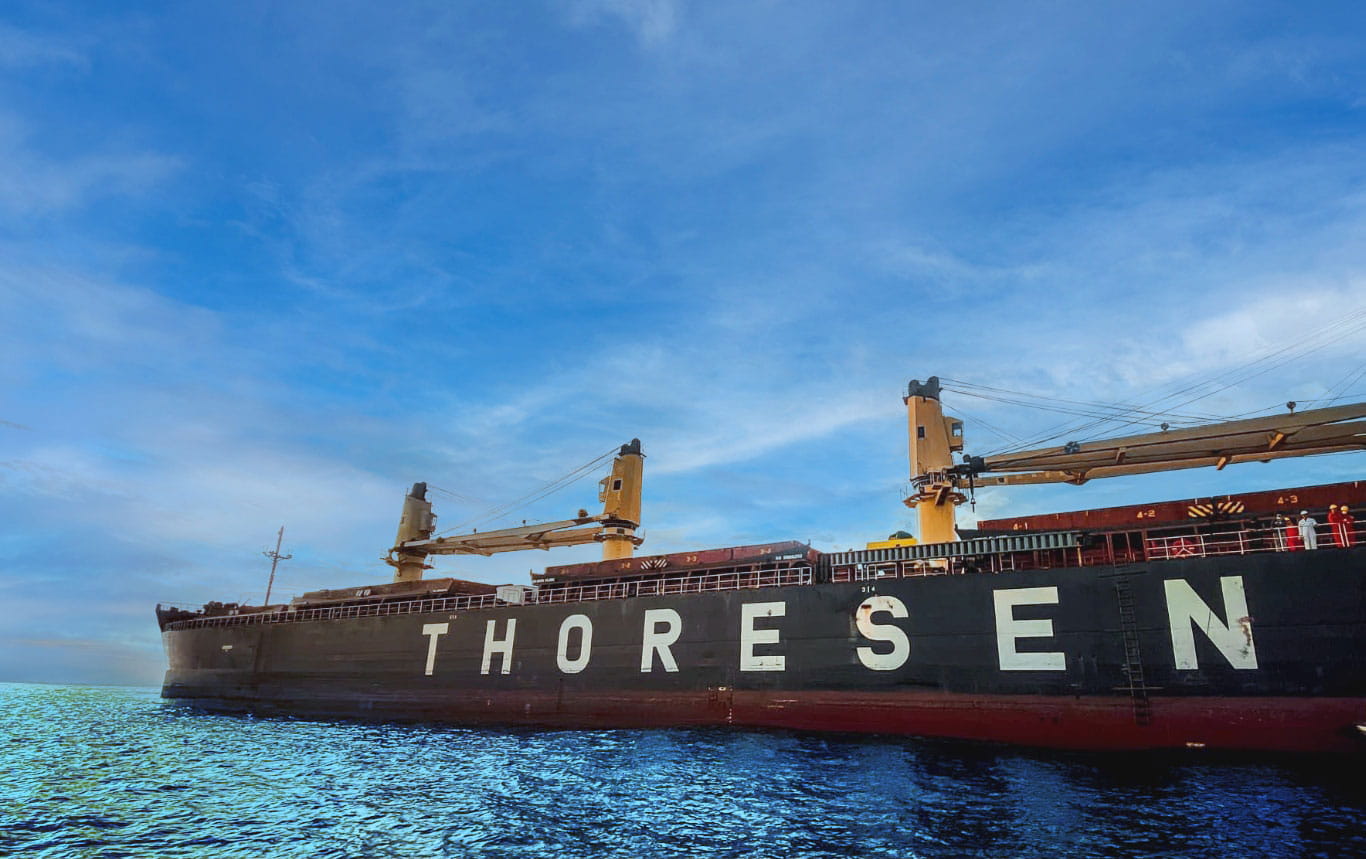
Shipping
Offshore Service
Argochemical
Food & Beverage
Food & Beverage
Other Investment
IR Corner
Welcome to Thoresen Thai Agencies Investor Relations. Here you will find all information about the Company’s key figures, the share, strategy and financial events.
Stock Quotes
Key Highlight Performance 2025
As of 31 December 2025
Unit :Million THB


Form 56-1 One Report FY 2025

IR E-Newsletter 1Q/2026
Latest News

TTA Reported 1Q/2026 Net Profit of Baht 200.8 million, Backed by Shipping Segment’s World-Class Operational Performance
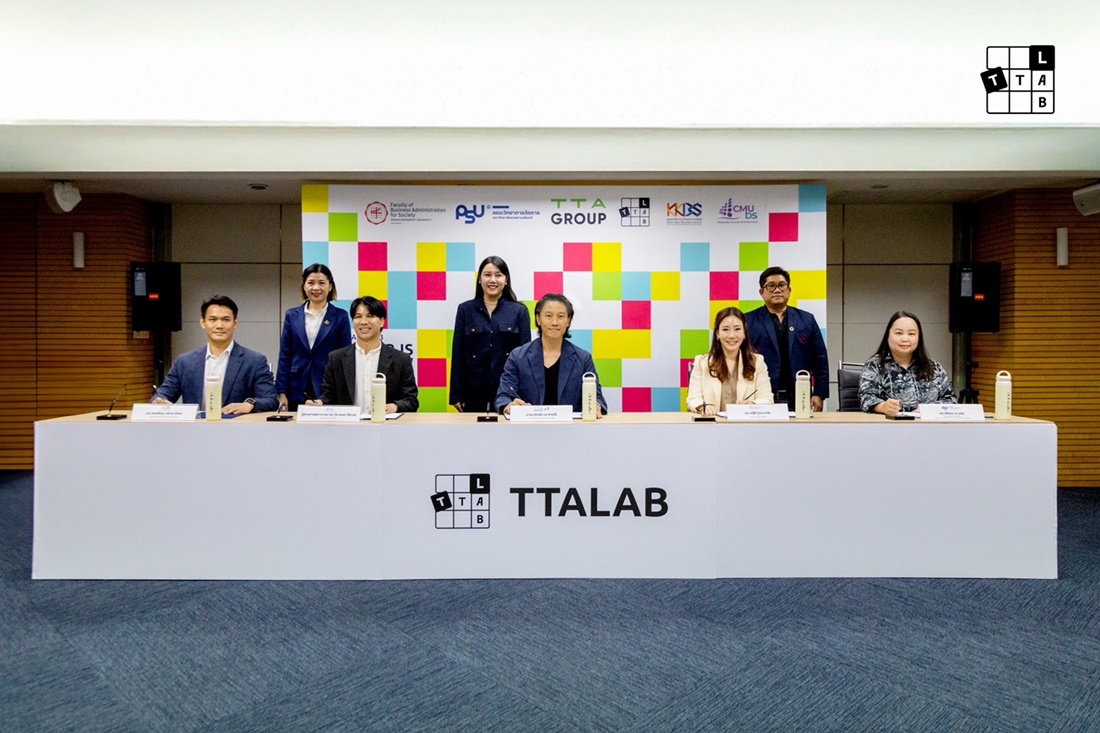
TTALAB ผนึก 4 มหาวิทยาลัยชั้นนำ เดินหน้าต่อยอดโครงการ TTALAB GEN 3 สร้างเยาวชนแห่งอนาคตผ่านนวัตกรรมเพื่อสังคม
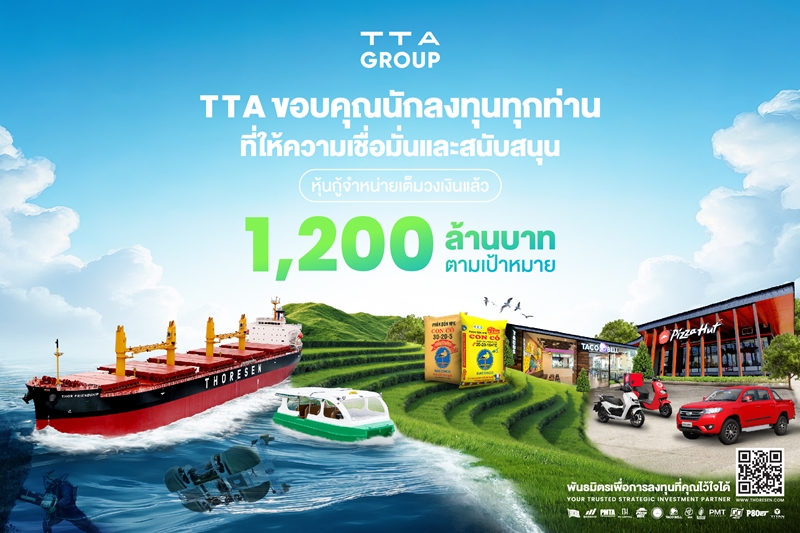
TTA Successfully Closes THB 1.2 billion Debenture Offering Strong Investor Response Reflects Confidence in Business Fundamentals

Whistleblowing Post Box
Thoresen Thai Agencies Public Company Limited’s Whistleblowing Policy is to enable genuine and legitimate concerns to be raised by employees, directors and others.